Voting-Systems-Simulation
Simulation for various voting systems


Check out on GitHub
Documentation:
Summary
What it is
This repository contains a script that performs simulations of various voting methods on randomly generated data.
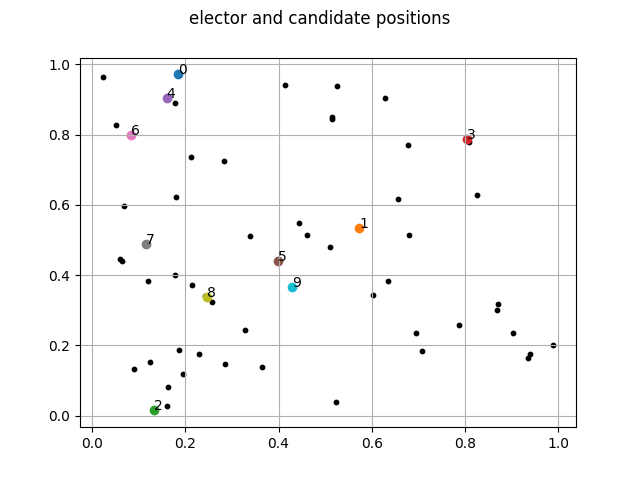
The opinions on the topic of your choice are represented as points in a finite dimensional vector space. This means elector and candidate positions are represented as coordinates in a vector space that can be a plane, a three dimensional space, or more.
Here is an image of what it looks like
The goals of the simulation are to see if there is any differences between the numerous voting methods, and if those differences exists, determine which ones better.
If you are just interested in the results and feel trustful, you can read the Related work section and then skip to Interpretation of the results section.
Related work
You might also be interested by this revue which compares many voting methods, explains how they work and their flaws.
This simulation is inspired by various videos
- (EN) Simulating alternate voting systems by Primer
- (FR / EN sub) Réformons l’élection présidentielle ! by ScienceEtonnante
- (FR / EN sub) Monsieur le président, avez-vous vraiment gagné cette élection ? by La statistique expliquée à mon chat
- (FR) Le MEILLEUR système de vote (et pourquoi c’est une mauvaise question) by Tzitzimitl - Esprit Critique
How to run
If you want to run the simulation, you can do as following
git clone https://github.com/Relex12/Voting-Systems-Simulation.git
cd Voting-Systems-Simulation
python3 simulation.py
This will give something similar into the output
plurality:               6
two round:               9
instant runoff:          9
condorcet:               3
borda:                   3
approval:                3
majority judgement:      3
and produce an image as img/positions.png of the position of the electors and the candidates.
CLI arguments
You can print the help message by running: python3 simulation.py -h
usage: simulation.py [-h] [-v] [-d DIMENSION] [-e ELECTORS] [-c CANDIDATES]
                     [-t THRESHOLD] [--noplot] [-r REPEAT] [-o OUTPUT]
                     [--test TEST]

optional arguments:
  -h, --help            show this help message and exit
  -v, --version         show program's version number and exit
  -d DIMENSION, --dimension DIMENSION
                        number of dimensions to use
  -e ELECTORS, --electors ELECTORS
                        number of electors for the simulation
  -c CANDIDATES, --candidates CANDIDATES
                        number of candidates for the simulation
  -t THRESHOLD, --threshold THRESHOLD
                        rejection threshold for scoring methods
  --noplot              creates the positions image
  -r REPEAT, --repeat REPEAT
                        number of repetitions of the simulation
  -o OUTPUT, --output OUTPUT
                        output file to write the results
  --test TEST           number of times to test the method given in the test()
                        function
Introduction to the code
The code is divided in two modules
simulation.pyis the main module, it will either computes the undecidability rate of the given method in the source code if--testis given as an argument (test()), or proceed with the simulation, first drawing lots for the position of electors and candidates (iniate_dict()), displaying the position inpositions.png(plot_grid()), and finally calculating the distances between the electors and the candidates (distance()) before performing the voting systems.voting.pyis the module containing the functions to elect a candidate based on electors preferences, details on the implementation and algorithms are available in the documentation.
Documentation
The documentation of simulation.py and voting.py modules is made with pdoc3. It is available in the doc/ folder on the repo. You can check it out online:
To generate the documentation, run pdoc --html -o doc/ *.py . You can also view the documentation in your browser at localhost:8080 by running pdoc --http : *.py.
Undecidability rate
Sometimes, some methods are just not able to pick a winner, because of the Condorcet paradox or because of an equality case. When this occurs, a None object is returned by the corresponding function. To estimate this rate, the methods have been tested 100000 (one hundred thousand) times each, using the --test command line argument, with the default values of 2 dimensions, 50 electors and 10 candidates. Here are the results
| Method | Estimated rate (%) |
|---|---|
| Plurality | 0.0 |
| Two rounds | 0.0 |
| Instant Runoff | 0.0 |
| Condorcet | 2.11 |
| Borda | 0.002 |
| Approval | 11.235 |
| Majority jugement | 2.01 |
Notes:
- For the Plurality, Two rounds and Instant Runoff methods, equality cases can only occur when there is a strict equality in the last round, which is very unlikely.
- For the Borda method, equality cases happened too often, so it has been decided to perform a Condorcet duel on the winning candidates. This is why the undecidability rate is so low, it happen only when both Borda and Condorcet methods cannot decide.
- For the Approval method, the high undecidability rate is due to a too small number of elector. If we perform the test as many times with 200 electors, this rate drops to 2.97%.
Flaws in the modeling
Before reading the interpretation of the results, there might be a few flaws in the simulation you have to be aware of. Considering these flaws doesn’t mean the simulation is bad, it simply means that in a real world problem, such an approach could only be used by an omniscient entity, or is likely to produce significant deviations from the observed results.
- Dimensional representation: It might be a quite bad simplification to represent someone’s position, whether a candidate or an elector, on a multi-dimensional vector space. Even with a large number of dimension, it might be impossible to convert an opinion, whatever the subject is, into a finite vector. Moreover, some variables might be qualitative instead of quantitative.
- Omniscient position evaluation: As complex as an opinion can be, we consider that everyone, electors and candidates, has the exact same knowledge of the others’ position. The effect of this flaw increases with the number of dimension: if you have to to place opinions in a vector space, it will be easier the less dimension you will have to deal with. This flaw is therefore incompatible with the previous one.
- Uniform repartition: Positions are randomly drawn in a uniform way between the two extreme values, but this doesn’t reflect reality. If you perform a statistical analysis on people’s opinion on a given subject, whatever it is, you will very likely observe correlations between variables. These correlations mean that if you have a certain position in a on a certain variable then you will be more likely to have this position on another variable. So theses correlations will lead to empty areas in the vector space.
- Uniform variable importance: Different variables on different dimensions might not have the same weight in the distance evaluation, because a different importance of the variable or a different value scale. Even more concerning, those different weights might depend on the position on other variables.
- No social pressure: Real people from the real live might adjust a little their voting position according to their environment, for example family and friends positions. This may lead to groups of close electors voting the same, even if they might have vote differently regardless of the group’s position.
- No media influence: The simulation supposes that every elector has a complete knowledge of the candidate’s position. In the real world, electors might not have all the information they need to vote, and will try to do their best according to what they know. Media exposure of candidates and media influence on electors might even depend on their position.
- No voting strategy: Regardless of their implementation, many of these voting methods have well-known flaws. If you are aware of theses, you should rationally betray your preferences, so that one of your favorite candidates has more chances to win the election. In the simulation, each elector is true to his or her preferences.
Note: For some of these flaws , you might want to consider that the variables that are used in the simulation are given by a logistic regression performed on the real variables used to evaluate everyone’s position. That means that you will have to evaluate positions on more variables, which is incompatible with the omniscient position evaluation flaw. Moreover, a logistic regression will induce at least slight a small approximation, that might highlight the dimensional representation flaw.
Interpretation of the results
For better understanding of the results, you can run the simulation several times and try to understanding what is going on between the method results and the generated position set.
The first thing we can observe is that the results are pretty different from one method to another. We can see that some methods often give similar results, that looks like a correlation, but it does not correspond every time. A statistical analysis is needed to establish stronger correlations. We can find out that some of these methods give a winner near the average position of electors, while other methods favor candidates without too many competitors in their area.
If there is only one question to remember it is this one:
Would you prefer to choose as winner a candidate against whom no one is really against or a candidate who has more supporters than opponents compared to his competitors?
Personal interpretation: In this and the next paragraph, and only in these, I give my opinion about how I interpret the results: I think that methods that promote candidates isolated from others are not the best, because the results depend more on the position of the other candidates than on those of the electors. However, it is the position of the electorate that the vote is supposed to reflect. In this way, the best voting methods are, in my opinion, those that allow electors to judge the candidates independently.
In systems that favor isolated candidates, candidates who might better reflect electors’ positions must struggle against each other, and it is this competition that allows isolated candidates to win.
Remaining work
To improve the simulation, the first thing to be done is to add other voting methods. Only seven of them have been implemented here, many others exist, and many variant of these method are also possible, giving sometimes different results.
Once we have more voting methods implemented, it would be great to make a statistical correlation study between the methods. The idea would be to run the simulation many times and store the results in a file, and then to estimate for each pair of methods the agreement rate, that is the frequency with which the methods give the same result.
Finally, to complete this analysis, variables like distribution indicators (median, average and standard deviation, for electors and candidates) and density indicators (for electors and candidates) must be also be used to find correlations and to be able to make a rigorous conclusion on the subject of voting methods.
License
The project is a small one. The code is given to the GitHub Community for free, only under the MIT License, that is not too restrictive.